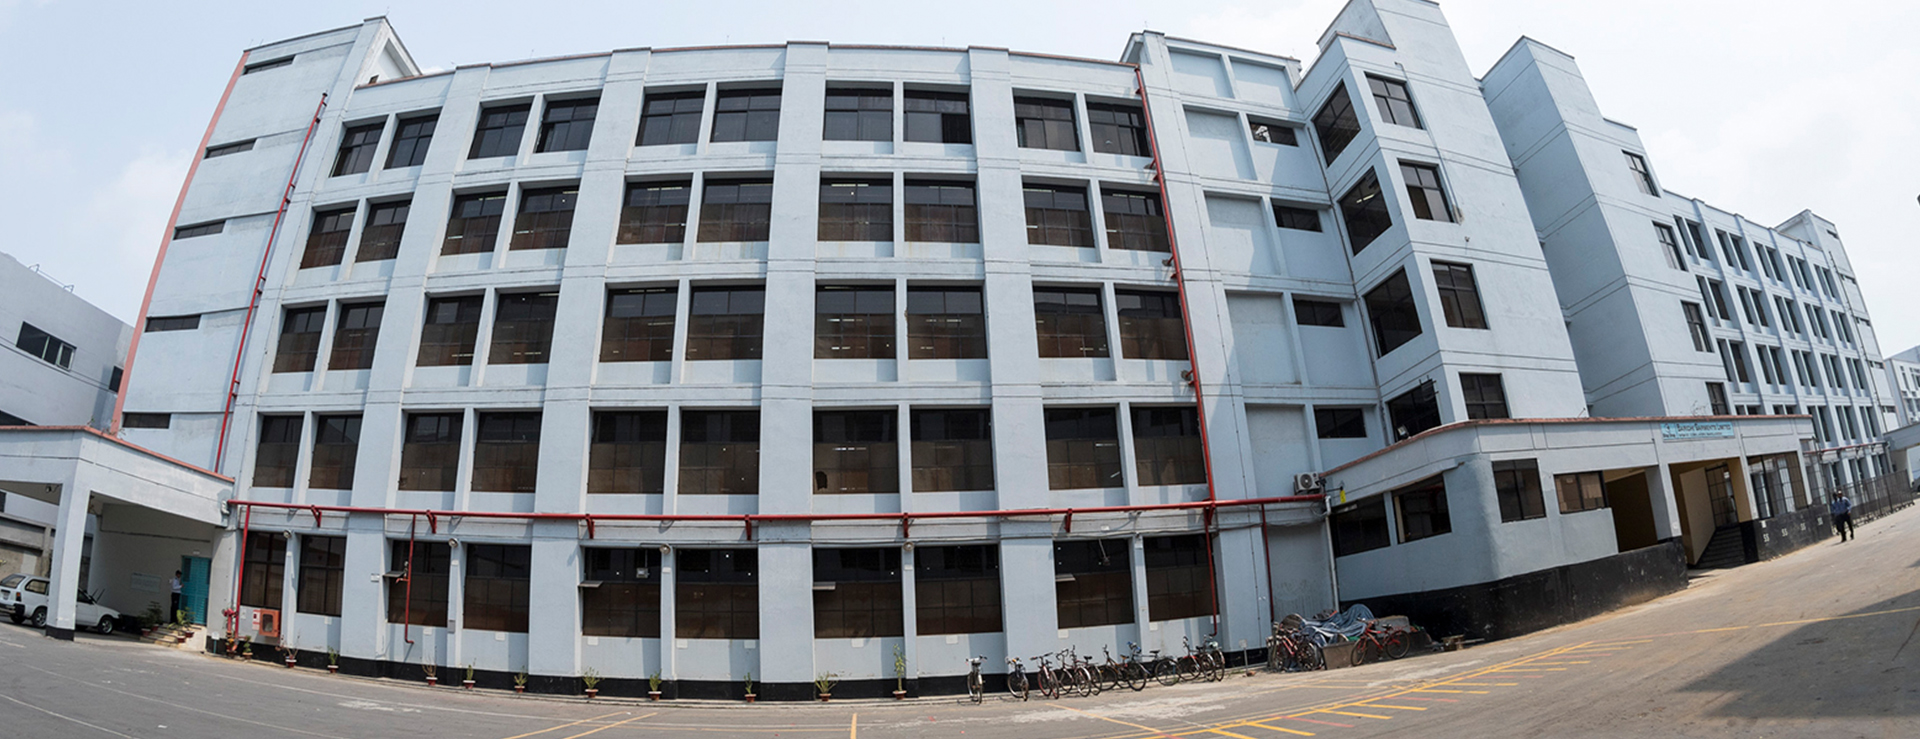

Tarasima Apparels Ltd
Electricity Consumed(KWH)-2016
| Month | Electricity Purchased(KWH) | Electricity from Generator (KWH) | Total Electricity Consumed (KWH) |
|---|---|---|---|
| January | 696,155 | 218,244 | 914,399 |
| February | 435,660 | 87,201 | 522,861 |
| March | 533,180 | 185,171 | 718,351 |
| April | 590,155 | 219,137 | 809,292 |
| May | 567,365 | 107,136 | 674,501 |
| June | 496,875 | 333,103 | 829,978 |
| July | 427,445 | 205,993 | 633,438 |
| August | 578,760 | 178,756 | 757,516 |
| September | 472,495 | 90,634 | 563,129 |
| October | 627,255 | 175,656 | 802,911 |
| November | 461,100 | 220,488 | 681,588 |
| December | 447,320 | 117,902 | 565,222 |
| Total | 6,333,765 | 2,139,421 | 8,473,186 |
Total Ground Water Withdrawal Summary - 2016
| Month | Water Consumption (M3) |
|---|---|
| January | 51,167.30 |
| February | 44,637.00 |
| March | 52,532.00 |
| April | 64,294.00 |
| May | 60,351.00 |
| June | 65,072.00 |
| July | 50,354.00 |
| August | 68,633.00 |
| September | 44,844.00 |
| October | 57,348.00 |
| November | 31,860.00 |
| December | 31,860.00 |
| Total | 622,952.30 |
Total Treated Water by ETP - 2016
| Month | ETP Inlet (M3) | ETP Outlet (M3) |
|---|---|---|
| January | 29,705 | 28,347 |
| February | 23,950 | 22,443 |
| March | 28,390 | 27,538 |
| April | 27,336 | 20,538 |
| May | 37,998 | 36,141 |
| June | 38,400 | 36,504 |
| July | 25,128 | 22,024 |
| August | 36,155 | 35,042 |
| September | 24,995 | 23,393 |
| October | 39,599 | 38,361 |
| November | 36,534 | 35,546 |
| December | 22,436 | 21,863 |
| Total | 370,626 | 347,740 |
Air Emission - 2016
| Sl No. | Parameters | CO (mg/Nm3) | CO2 (%) | NO (mg/Nm3) | NOX (mg/Nm3) | SO2 (mg/Nm3) | O2 (%) |
|---|---|---|---|---|---|---|---|
| 1 | Boiler 1 | 59 | 3.9 | 0 | 34 | 26.3 | 2.38 |
| 2 | Boiler 2 | 90 | 4.9 | 0 | 132 | 32 | 1.7 |
| 3 | Generator-1 | 187.3 | 4.2 | 106 | 414 | 40 | 9 |
| 4 | Generator 2 | 171.3 | 2.74 | 180 | 228 | 25.7 | 10 |
| 5 | Generator 3 | 332 | 4.47 | 155 | 216.6 | 0 | 9.4 |
Total GHG Emission - 2016
| Month | Tonnes |
|---|---|
| January | 1,243.304 |
| February | 1,125.937 |
| March | 1,033.959 |
| April | 1,202.93 |
| May | 1,106.764 |
| June | 1,164.312 |
| July | 1,049.644 |
| August | 1,159.458 |
| September | 1,140.461 |
| October | 1,235.544 |
| November | 853.491 |
| December | 924.649 |
| Total | 13,240.453 |
Waste is any substance or object which is discarded, intended to be discarded or is required to be discarded. Waste can include expired raw materials generated from a process for which there is no further use on-site, expired finished products, process or non-process by-products, customer returns, redundant equipment, etc. It can also include electronic waste (or “e-waste”). (Higg 2.0-How to Higg Guide, V1.0, pg 66).
Waste generated in a facility can be classified mainly into two categories:
1) Hazardous waste
2) Non-hazardous waste
A hazardous waste is a waste that could cause harm to public health and/or the environment because of its chemical, physical or biological characteristics (e.g., it is flammable, explosive, toxic, radioactive, or infectious). Hazardous wastes that is dangerous or potentially harmful to our health or the environment. Hazardous wastes can be liquids, solids, gases, or sludge. They can be discarded commercial products, like cleaning fluids or pesticides, or the by-products of manufacturing processes. (The U.S. Environmental Protection Agency) (Higg 2.0-How to Higg Guide, V1.0, pg 66).
1) Process/ Production waste and
2) Non-process/ Non-Production waste
Example:
- Waste from, dyeing, washing, printing, embroidery, cutting, sewing, finishing, packaging & finishing
- Waste from warehouse/ storeroom
- Waste from printing, embroidery
- Rejected garments
- Rejected / unused dyes & chemicals
- Laboratory waste
- ETP sludge & Unused ETP chemicals
Example:
- Office waste – paper, cartoons, used printer/photo copier ink/toners
- Medical waste
- Electronic waste- used bulbs, tube lights, batteries, monitor
- Oil, grease, leftover diesel
- Burned diesel
- Metallic and maintenance wastes
- Chemical drums & containers
- Paint

| Waste Matrix | ||
|---|---|---|
| Type of Waste | Process Waste | Non-Process Waste |
| Non-hazardous Waste |
Non-hazardous Process Waste e.g.- Fabric cut piece, Cardboard |
Non-hazardous Non-Process Waste e.g.- Office Waste, Paper |
| Hazardous Waste |
Hazardous Process Waste e.g.- Rejected / Unused dyes & Chemicals, Cardboard |
Hazardous Process Waste e.g.- Medical Waste, Chemical Drum, Tube lights, Batteries |
| Process Waste | |||||
|---|---|---|---|---|---|
| SL NO | Waste Name | Source Of Waste | Waste Classification(Non-Hazardous/Hazardous) | Waste Quantity(Kg/Pcs) | Waste Disposal Route |
| 1 | Jhute | Production floor | Non-hazardous | 371,814 | Handover to retailer |
| 2 | Cartoon | Production floor | Non-hazardous | 48,262 | Handover to retailer |
| 3 | Poly | Production floor | Non-hazardous | 1,724 | Handover to retailer |
| 4 | Thread cone | Production floor | Non-hazardous | 610 | Handover to retailer |
| Non-Process Waste | ||||||
|---|---|---|---|---|---|---|
| SL NO | Waste Name | Source Of Waste | Waste Classification(Non-Hazardous/Hazardous) | Waste Quantity | Unit | Waste Disposal Route |
| 1 | Paper | Production floor | Non-hazardous | 6,446 | Kg | Handover to retailer |
| 2 | Wastage Metal Scrap | Construction | Non-hazardous | 28,989 | Kg | Handover to retailer |
| 3 | Wastage Plastic | Construction | Non-hazardous | 2,638 | Kg | Handover to retailer |
| 4 | Old Lube Oil (Drum) | Utility | Non-hazardous | 13 | Kg | Handover to retailer |
| 5 | Wastage Wood | Utility | Non-hazardous | 7,812 | Kg | Handover to retailer |
| 6 | Wastage Tin | Utility | Non-hazardous | 1,584 | Kg | Handover to retailer |
| 7 | Wastage chair | Office area | Non-hazardous | 18 | Kg | Handover to retailer |
| 8 | Wastage Plastic drum(Pcs) | Production floor | Non-hazardous | 332 | Kg | Handover to retailer |
| 9 | Wastage Plastic Gallon(Pcs) | Production floor | Non-hazardous | 1,268 | Kg | Handover to retailer |
| 10 | Wastage Thai | Production floor | Non-hazardous | 50 | Kg | Handover to retailer |
| 11 | Wastage metal Drum | Production floor | Non-hazardous | 1,442 | Kg | Handover to retailer |
| 12 | SS Rack | Production floor | Non-hazardous | 98 | Kg | Handover to retailer |
| 13 | Wastage Copper | Utility | Non-hazardous | 93 | Kg | Handover to retailer |
| 14 | Wastage Bleaching drum | Production floor | Non-hazardous | 6,480 | Kg | Handover to retailer |
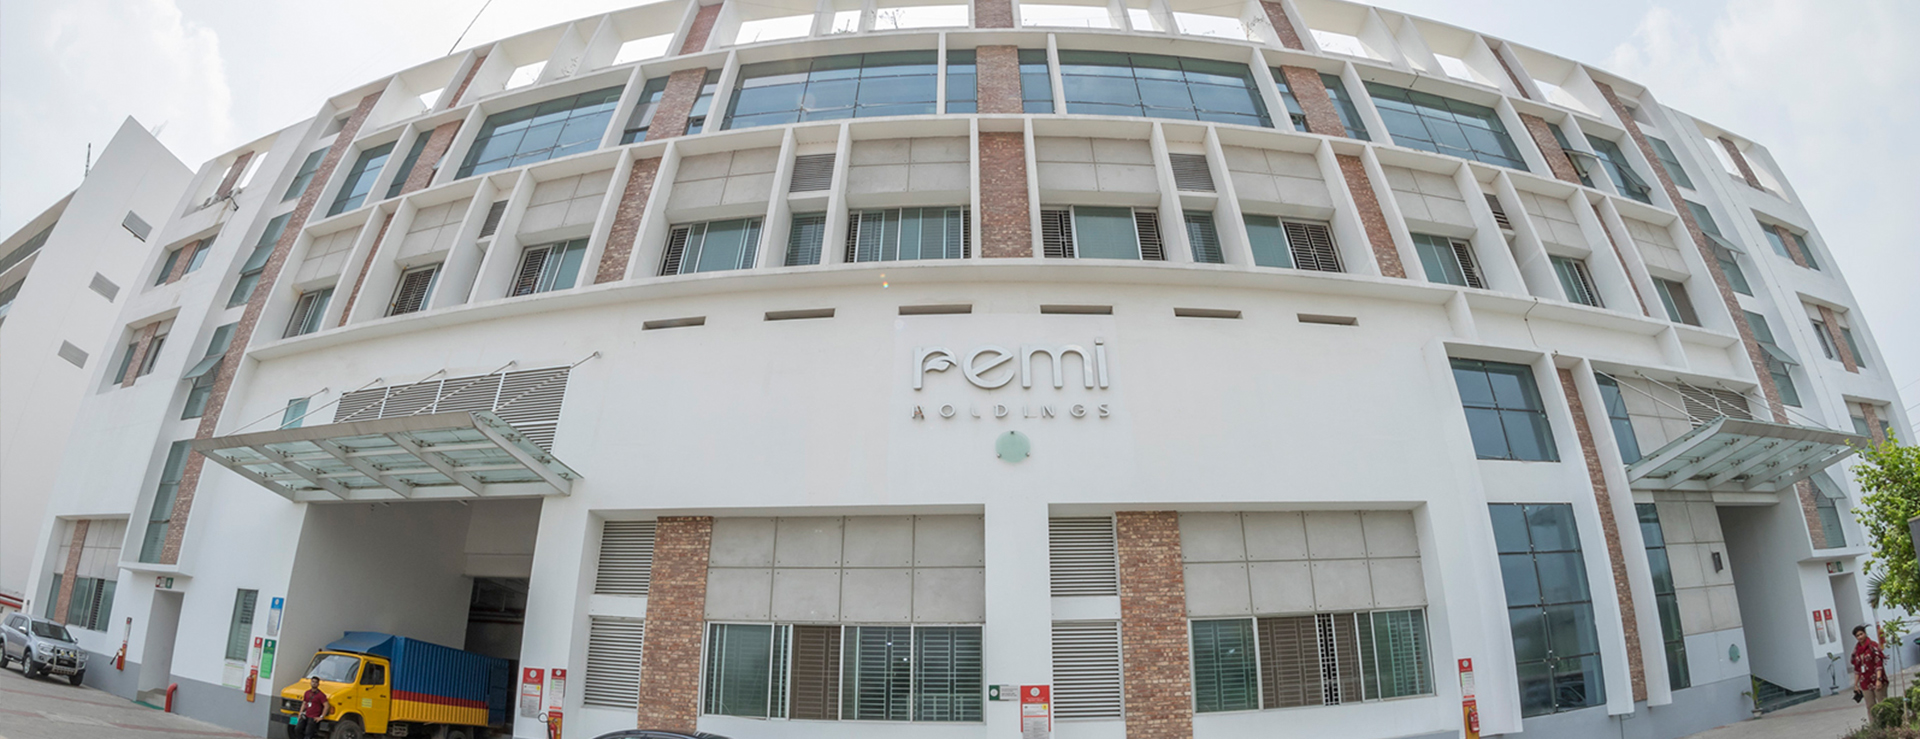
Remi Holdings Limited
Electricity Consumed(KWH)-2016
| Month | Electricity Purchased (KWH) | Electricity from generator (KWH) | Total Electricity Consumed (KWH) |
|---|---|---|---|
| January | 26,533.5 | 230 | 26,764 |
| February | 56,565.38 | 250 | 56,815 |
| March | 62,913.75 | 120 | 63,034 |
| April | 68,460 | 301 | 68,761 |
| May | 83,970 | 457 | 84,427 |
| June | 72,540 | 645 | 73,185 |
| July | 121,020 | 549 | 121,569 |
| August | 126,750 | 1,156 | 127,906 |
| September | 89,280 | 1,692 | 90,972 |
| October | 144,780 | 297 | 145,077 |
| November | 138,810 | 126 | 138,936 |
| December | 105,570 | 373 | 105,943 |
| Total | 1,097,192.63 | 6,196 | 1,103,389 |
Total Ground Water Withdrawal Summary - 2016
| Month | Water Consumption (M3)) |
|---|---|
| January | 981 |
| February | 721 |
| March | 671 |
| April | 773 |
| May | 2,070 |
| June | 2,492 |
| July | 2,500 |
| August | 3,242 |
| September | 1,897 |
| October | 2,209 |
| November | 3,081 |
| December | 2,214 |
| Total | 22,851 |
Total Treated Water by ETP - 2016
| Month | ETP Inlet (M3) | ETP Outlet (M3) |
|---|---|---|
| January | 0 | 0 |
| February | 0 | 0 |
| March | 0 | 0 |
| April | 0 | 0 |
| May | 0 | 0 |
| June | 734 | 350 |
| July | 1,020 | 497 |
| August | 1,116 | 521 |
| September | 600 | 317 |
| October | 455 | 144 |
| November | 1,454 | 719 |
| December | 1,201 | 661 |
| Total | 6,580 | 3,209 |
Air Emission - 2016
| Sl No. | Parameters | CO ( %) | CO2 (%) | SPM (mg/Nm3) | NOx (mg/Nm3) | SO2 (mg/Nm3) | O2 (%) |
|---|---|---|---|---|---|---|---|
| 1 | Incineration Boiler | 2.20% | 2.50% | 11.12 | 44.11 | 67.17 | 11.10% |
| 2 | Thermo Oil Boiler | Not done | Not done | - | Not done | Not done | Not done |
| 3 | Generator 1(1030 KVA) | Not done | Not done | - | Not done | Not done | Not done |
| 4 | Generator 2 (220KVA) | 3.10% | 3.60% | 7.22 | 28.07 | 102.21 | 12.10% |
Total GHG Emission - 2016
| Month | Tonnes |
|---|---|
| January | 15.392 |
| February | 32.675 |
| March | 36.252 |
| April | 39.546 |
| May | 48.555 |
| June | 42.09 |
| July | 69.916 |
| August | 73.561 |
| September | 52.319 |
| October | 83.436 |
| November | 79.904 |
| December | 60.93 |
| Total | 634.576 |
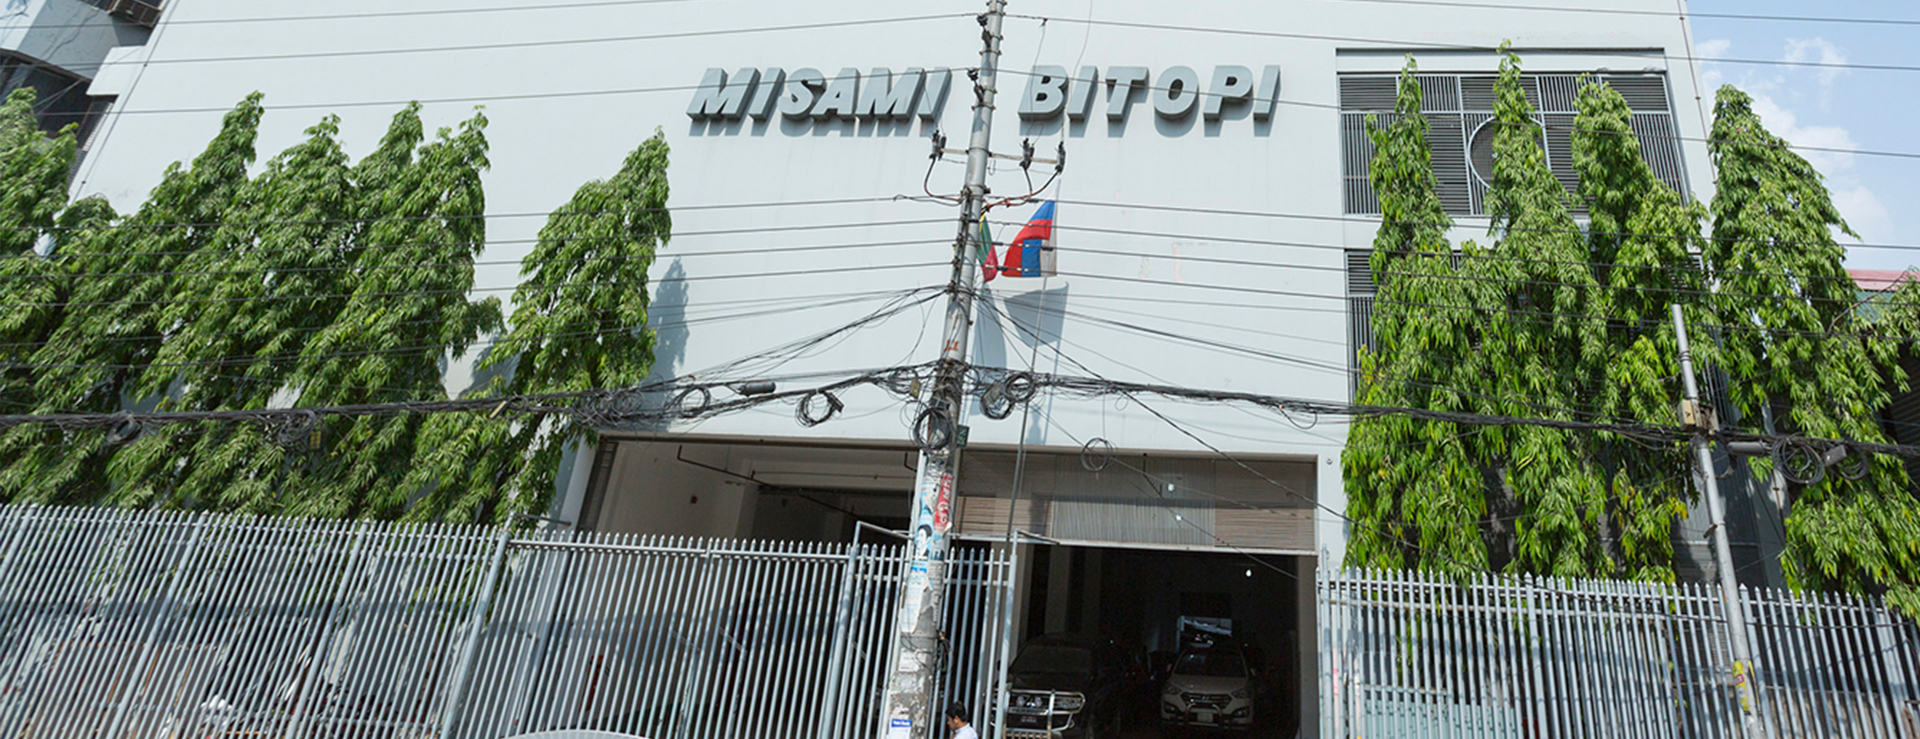
Misami Garments Limited
Electricity Consumed(KWH)-2016
| Month | Electricity Purchased (KWH) | Electricity from generator (KWH) | Total Electricity Consumed (KWH) |
|---|---|---|---|
| January | 83,160 | 6,515 | 89,675 |
| February | 89,460 | 2,988 | 92,448 |
| March | 105,844 | 0 | 105,844 |
| April | 98,280 | 4,722 | 103,002 |
| May | 100,800 | 0 | 100,800 |
| June | 117,180 | 1,701 | 118,881 |
| July | 100,800 | 0 | 100,800 |
| August | 110,880 | 1,491 | 112,371 |
| September | 80,640 | 420 | 81,060 |
| October | 915,198 | 672 | 915,870 |
| November | 765,208 | 2,027 | 767,235 |
| December | 633,807 | 4,904 | 638,711 |
| Total | 3,201,257 | 25,440 | 3,226,697 |
Total Ground Water Withdrawal Summary - 2016
| Month | Water Consumption (M3)) |
|---|---|
| January | 2,665 |
| February | 3,027 |
| March | 2,935 |
| April | 7,339 |
| May | 2,850 |
| June | 3,081 |
| July | 4,454 |
| August | 3,201 |
| September | 2,705 |
| October | 3,457 |
| November | 3,726 |
| December | 3,460 |
| Total | 42,900 |
Waste is any substance or object which is discarded, intended to be discarded or is required to be discarded. Waste can include expired raw materials generated from a process for which there is no further use on-site, expired finished products, process or non-process by-products, customer returns, redundant equipment, etc. It can also include electronic waste (or “e-waste”). (Higg 2.0-How to Higg Guide, V1.0, pg 66).
Waste generated in a facility can be classified mainly into two categories:
1) Hazardous waste
2) Non-hazardous waste
"A hazardous waste is a waste that could cause harm to public health and/or the environment because of its chemical, physical or biological characteristics (e.g., it is flammable, explosive, toxic, radioactive, or infectious). Hazardous wastes that is dangerous or potentially harmful to our health or the environment. Hazardous wastes can be liquids, solids, gases, or sludge. They can be discarded commercial products, like cleaning fluids or pesticides, or the by-products of manufacturing processes. (The U.S. Environmental Protection Agency)"" (Higg 2.0-How to Higg Guide, V1.0, pg 66).
Example:
- Waste from, dyeing, washing, printing, embroidery, cutting, sewing, finishing, packaging & finishing
- Waste from warehouse/ storeroom
- Waste from printing, embroidery
- Rejected garments
- Rejected / unused dyes & chemicals
- Laboratory waste
- ETP sludge & Unused ETP chemicals
Example:
- Office waste – paper, cartoons, used printer/photo copier ink/toners
- Medical waste
- Electronic waste- used bulbs, tube lights, batteries, monitor
- Oil, grease, leftover diesel
- Burned diesel
- Metallic and maintenance wastes
- Chemical drums & containers
- Paint

| Waste Matrix | ||
|---|---|---|
| Type of Waste | Process Waste | Non-Process Waste |
| Non-hazardous Waste |
Non-hazardous Process Waste e.g.- Fabric cut piece, Cardboard |
Non-hazardous Non-Process Waste e.g.- Office Waste, Paper |
| Hazardous Waste |
Hazardous Process Waste e.g.- Rejected / Unused dyes & Chemicals, Cardboard |
Hazardous Process Waste e.g.- Medical Waste, Chemical Drum, Tube lights, Battries |
| Process Waste | |||||
|---|---|---|---|---|---|
| SL NO | Waste Name | Source Of Waste | Waste Classification(Non-Hazardous/Hazardous) | Waste Quantity(Kg/Pcs) | Waste Disposal Route |
| 1 | Jhute | Production floor | Non-hazardous | 22,920 | Handover to retailer |
| Non-Process Waste | ||||||
|---|---|---|---|---|---|---|
| SL NO | Waste Name | Source Of Waste | Waste Classification(Non-Hazardous/Hazardous) | Waste Quantity | Unit | Waste Disposal Route |
| 1 | Thai Sheet | Production and office area | Non-hazardous | 100 | Kg | Handover to retailer |
| 2 | Tube light Shade | Production and office area | Non-hazardous | 50 | Kg | Handover to retailer |
| 3 | Broken Ladder | Production and office area | Non-hazardous | 25 | Kg | Handover to retailer |
| 4 | Clutch Motor | Production and office area | Non-hazardous | 100 | Kg | Handover to retailer |
| 5 | Reject Ceiling Fan | Production and office area | Non-hazardous | 240 | Kg | Handover to retailer |
| 6 | Reject Ceiling moving Fan | Production and office area | Non-hazardous | 105 | Kg | Handover to retailer |
| 7 | Ceiling Fan Blade | Production and office area | Non-hazardous | 44 | Kg | Handover to retailer |
| 8 | Reject Cable | Production and office area | Non-hazardous | 45 | Kg | Handover to retailer |
| 9 | M.S Pipe,Angle bar | Production and office area | Non-hazardous | 500 | Kg | Handover to retailer |
| 10 | M.S Plate | Production and office area | Non-hazardous | 100 | Kg | Handover to retailer |
| 11 | Broken Super wire | Production and office area | Non-hazardous | 12 | Kg | Handover to retailer |
| 12 | Wastage chair | Production and office area | Non-hazardous | 168 | Kg | Handover to retailer |
| 13 | Wastage Battary | Production and office area | Hazardous | 50 | Kg | Handover to retailer |
| 14 | Wooden door | Production and office area | Non-hazardous | 525 | Kg | Handover to retailer |




Waste Treatment Process
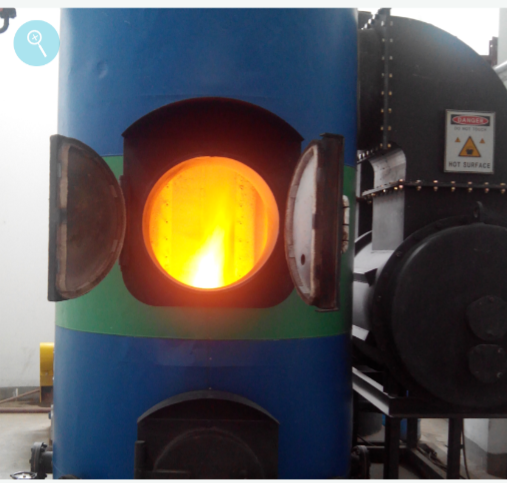
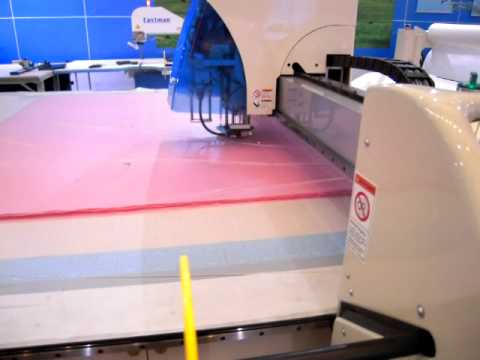
To minimize the volume and disposal costs of the wastes generated at the different units, TAL installed a 2 ton incineration boiler, which uses factory wastes - fabric waste, thread cones, and carton boxes/paper as combustion fuel.
Biogas is the product of the natural biological breakdown of organic & carbon-rich waste when the supply of oxygen is restricted. Our technology extracts the value contained in non-recyclable waste by producing 'biogas', a methane-rich natural gas.
It is renewable Source of Energy where wastage food has been using as a raw material. Instead of disposing of the food waste used every day, the factory uses it as feedstock for its biogas plant for cooking
